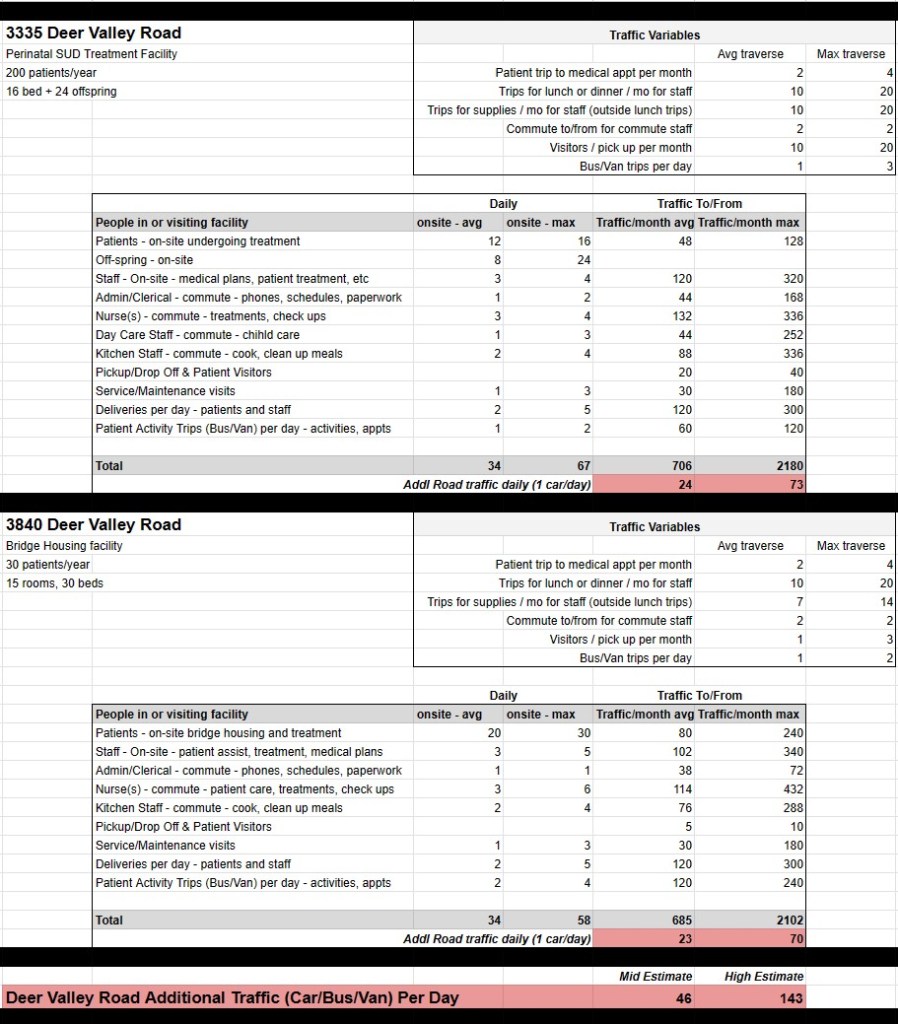
In an effort to estimate the amount of new car traffic these proposed two facilities would add to Deer Valley Road, I created a simple spreadsheet. For each facility I estimated the average and max number for staff (on-site and commuting in), patients, deliveries, bus/van trips and visitors. For each variable, I estimated the number of “traverses” each month. A traverse is a car going/or coming to/from the facility, traveling the 1.4 miles from Green Valley Road to the facilities off Deer Valley Road.
I created a list of traffic variables and estimated the traverses for each variable for “avg” and “max” analysis. For instance – “Patient trip to medical appt per month” would be 2 medical appt trips per patient, per month for the “avg” analysis, and up to 4 patient medical appts per patient for the “max” analysis. I then use this variable in the full table. In this case, Patient Trips would be multiplied by number of patients onsite, times 2 traverses, for the totals shown in “Traffic To/From” column.
In the table below I show my numbers. I will be the first to admit that I am not a traffic expert, but I feel these estimates give a good ballpark of additional cars driving down Deer Valley Road based on these proposed developments. Let me know if you find flaws in my logic.